Yesterday's OHLC Dashed Lines: Navigating Mike's Daily Landscape
.
Yesterday's OHLC Dashed Lines: Navigating Mike's Daily Landscape
While Mike (Volatility Mike) is our primary lens for understanding daily percentage change, its movement doesn't occur in a vacuum. To fully interpret Mike's action, especially in real-time, it's crucial to understand its relationship to the foundational price levels of the previous trading day.
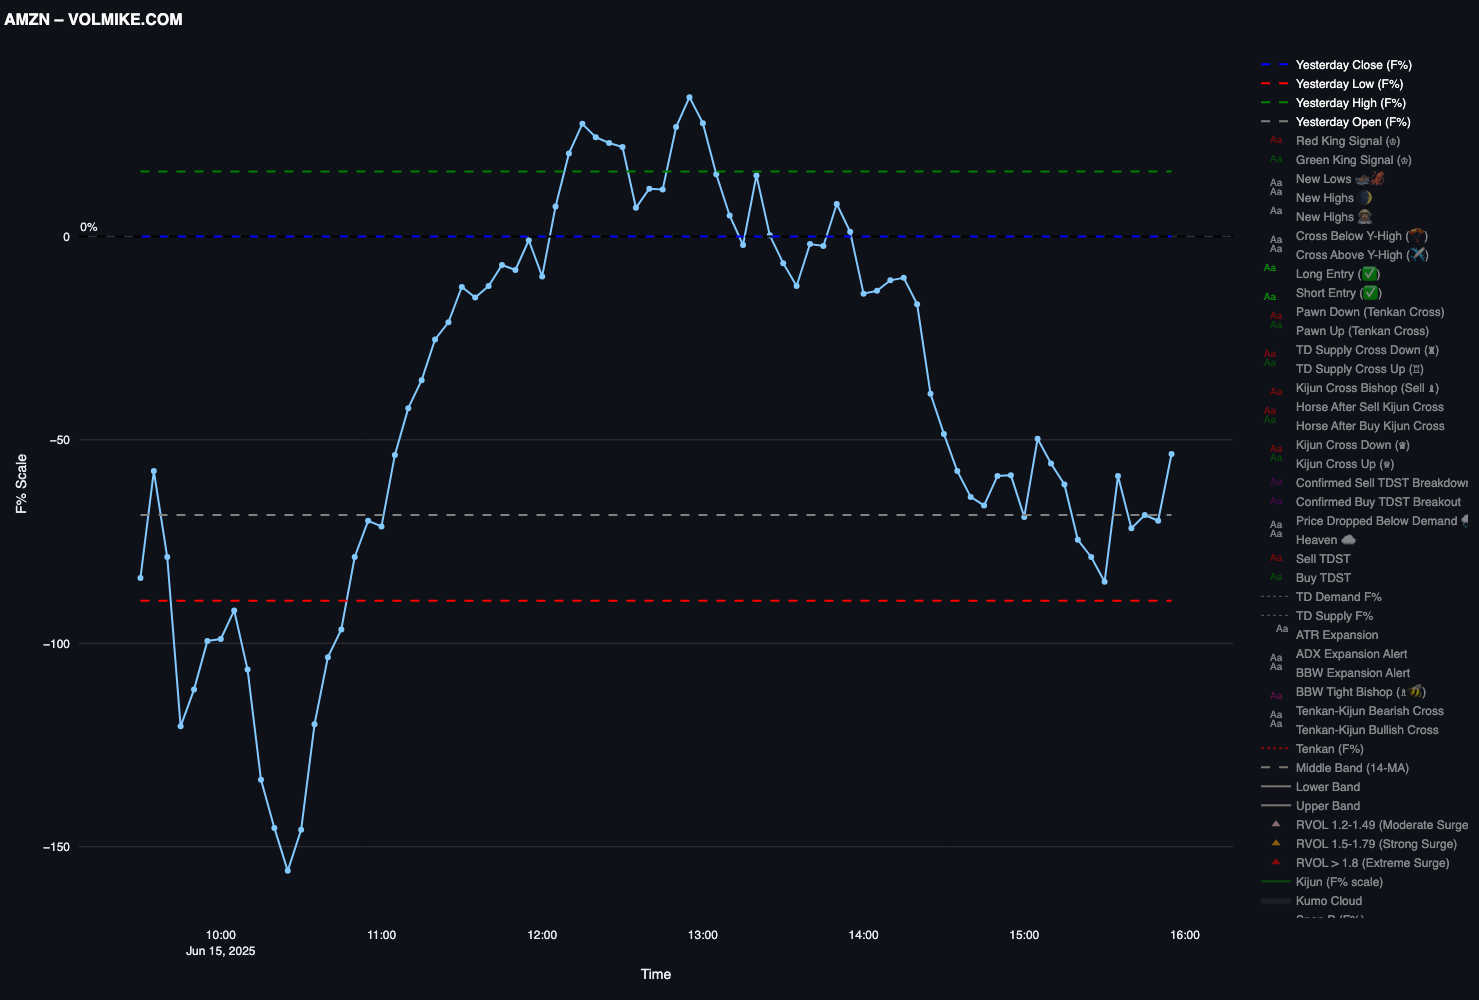
On your Mike Dashboard and in our "Opus" card charts, you'll consistently see four intuitively colored dashed lines. These lines represent Yesterday's Open, High, Low, and Close prices. They act as critical anchors and reference points, helping us anticipate where Mike might encounter natural areas of interaction, support, or resistance during the current trading session.
Think of them as the terrain features of yesterday's trading landscape, over which Mike navigates today.
The Significance of Each Line:
-
🔵 Blue Dash: Yesterday's Open.
- Meaning: This marks the precise price where trading began on the previous day.
- Why it Matters for Mike: It often acts as a psychological level. If Mike (and thus price) holds above or breaks below this line, it can signal a continuation of the prior day's opening momentum or a strong reversal.
-
⚪ Gray Dash: Yesterday's Close.
- Meaning: This is where the market concluded the previous trading day.
- Why it Matters for Mike: The previous close is a magnet. Mike's tendency to pivot around this line, or to decisively break away from it, tells us a lot about the current day's directional conviction. It's also the direct reference point for Mike's own calculation!
-
🟢 Green Dash: Yesterday's High.
- Meaning: The absolute highest price reached during the entire previous trading day.
- Why it Matters for Mike: This is a strong overhead resistance level. If Mike's positive momentum pushes price to approach or break above yesterday's high, it signifies significant bullish strength and a potential expansion of the daily range.
-
🔴 Red Dash: Yesterday's Low.
- Meaning: The absolute lowest price reached during the entire previous trading day.
- Why it Matters for Mike: This is a critical support level. If Mike's negative momentum drives price down to approach or break below yesterday's low, it indicates significant bearish weakness and a potential expansion of the downside.
How Mike Interacts with These Lines:
By observing Mike's trajectory and the current price action in relation to these dashed lines, we gain immediate insights:
- Breaking Above/Below: A decisive move by Mike (and price) to clear a previous day's high or low, especially with accompanying volume (our "Horse" signal), often signifies a continuation of momentum and the potential for a new short-term trend.
- Holding/Rejecting: Mike's tendency to "respect" these lines (bouncing off them or consolidating around them) can indicate areas of temporary support or resistance, allowing us to anticipate short-term pauses or reversals.
- Range Context: These lines quickly define yesterday's range, helping us understand if today's action is still within that range, attempting to expand it, or rejecting it entirely.
These lines are fundamental to understanding the context of Mike's movement, providing crucial reference points for identifying high-probability "Marengo" setups. They are integral to the "clean structure" and "full structure alignment" we emphasize in every "Opus" card.